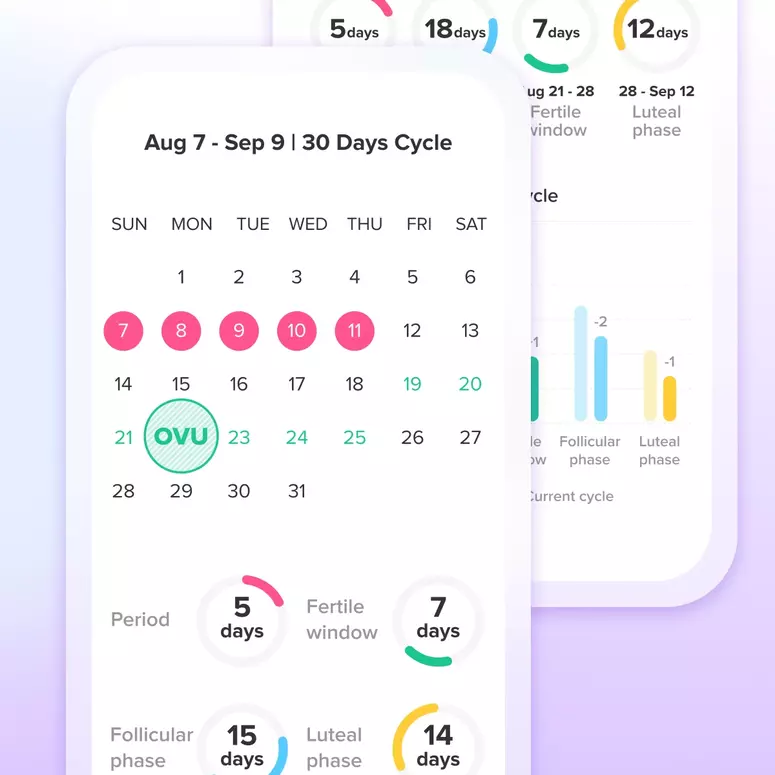
I don't know how to interpret these charts!
Can anyone shed some light on my chart?

Add Comment
Let's Glow!
Achieve your health goals from period to parenting.


