Understanding Bbt chart please help!!!
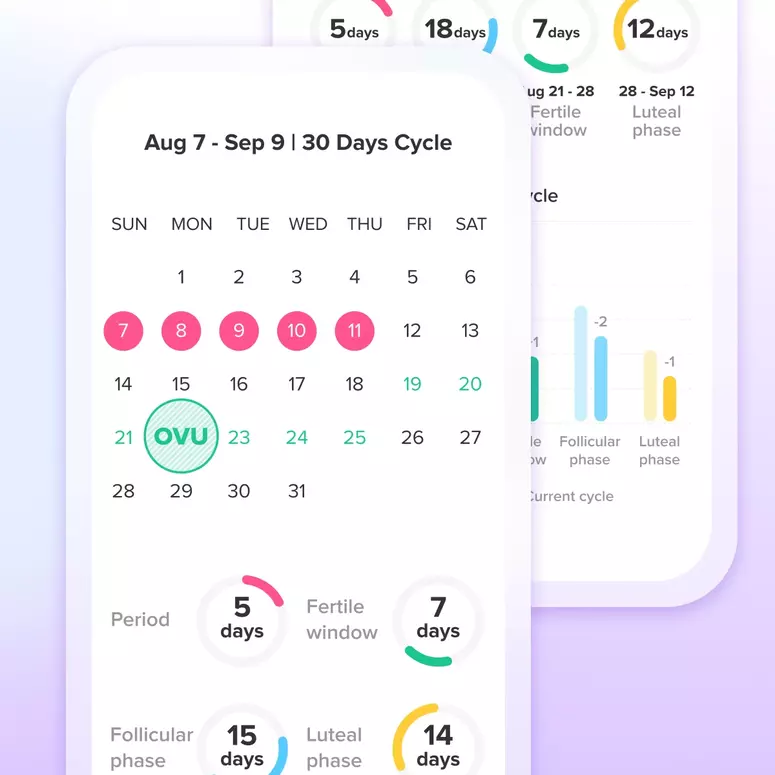
This is my 2nd month charting and I'm trying to get an understanding of how this works. According to glow I am suppose to ovulate today I am on cd 15. My chart is so jagged and I thought temps are suppose to increase until ovulation happens so why does my chart look like a mountain? fyi I take my temp at the same time every morning. Please help me understand.

Add Comment
Let's Glow!
Achieve your health goals from period to parenting.


