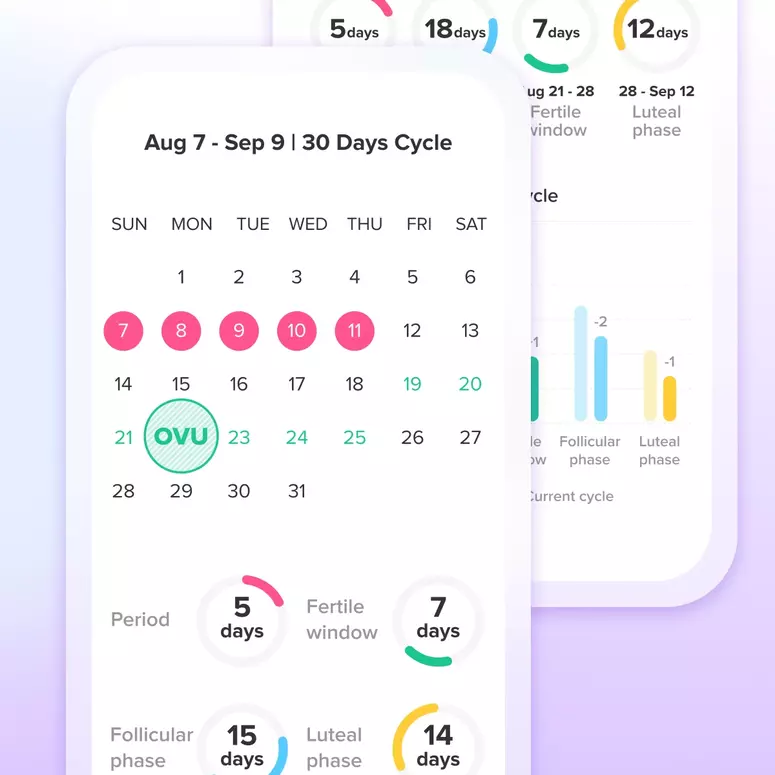
new to charting and just wondering if these look like normal range of fluctuations?

Add Comment
Let's Glow!
Achieve your health goals from period to parenting.


