Help understanding my chart please
Hey everyone,
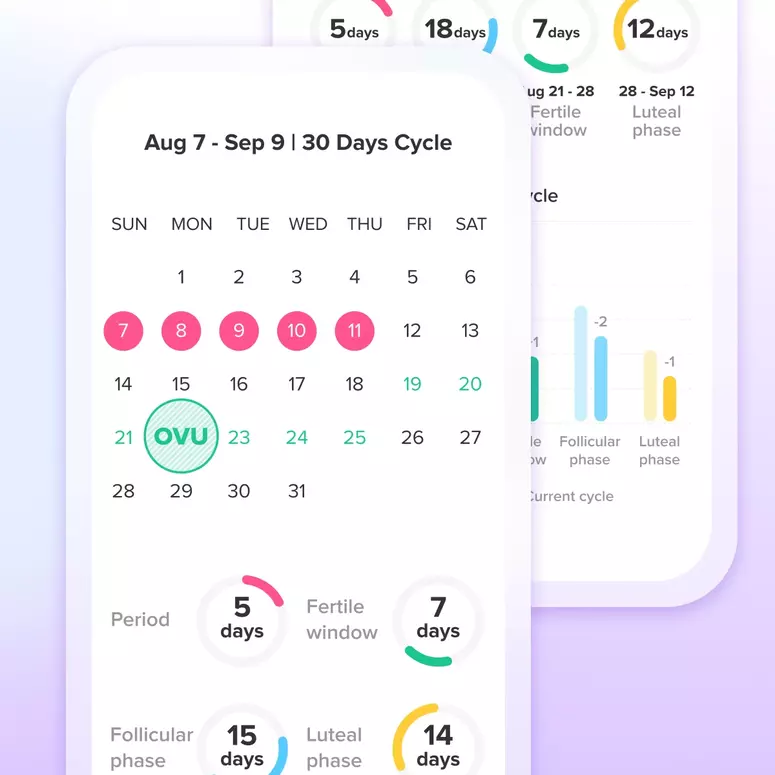
I’ve always been so shy to post in here lol everyone is always so supportive and helpful so that eased me a bit. I’d like some help understanding my chart. I see that i ovulated around CD 16-19 (the app told me so) and i also see a rise in temps around that time. Is this correct or am i wrong? Does my chart look good? Thanks in advance & baby dust to all ❤️

Add Comment
Let's Glow!
Achieve your health goals from period to parenting.
