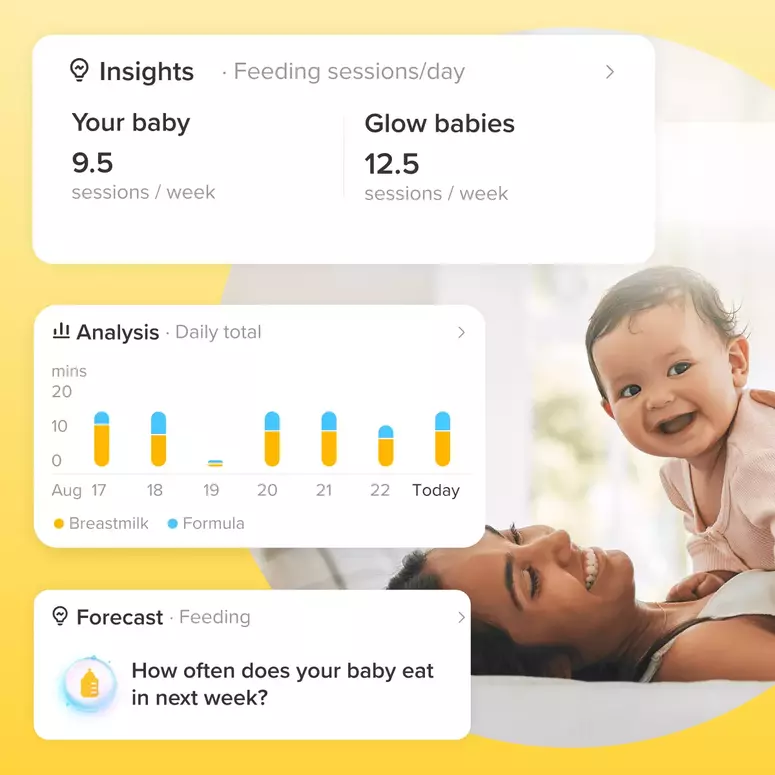
Does anyone understand this chart?
Please help me understand this chart?

Vote below to see results!
Add Comment
Let's Glow!
Achieve your health goals from period to parenting.