BBT chart help please
Can anyone tell me why my chart looks so complicated this month!? Last cycle my cover line was at 36.2- this month my temps seem to go up and down a lot!
Thanks in advance
Add Comment

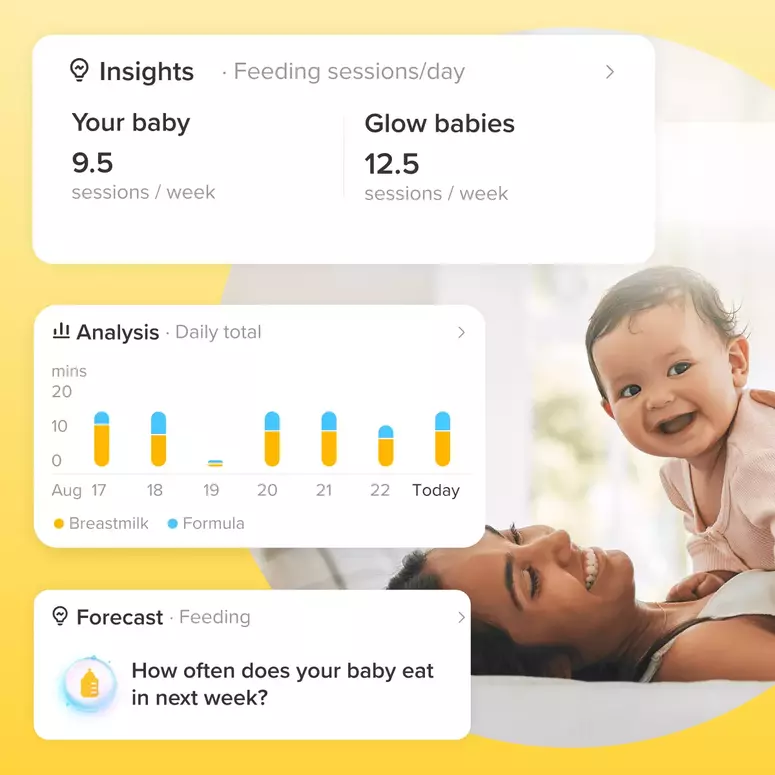
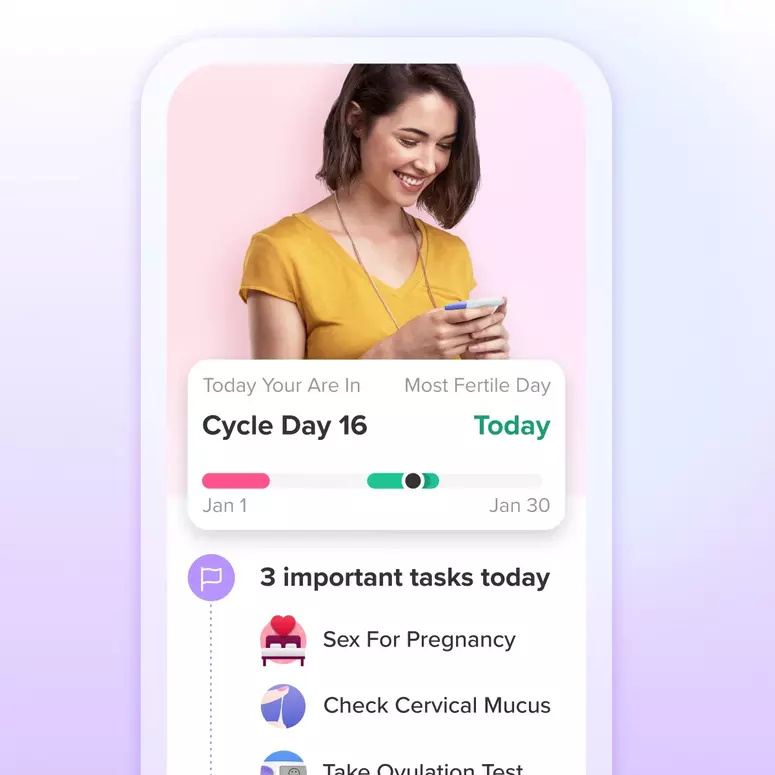
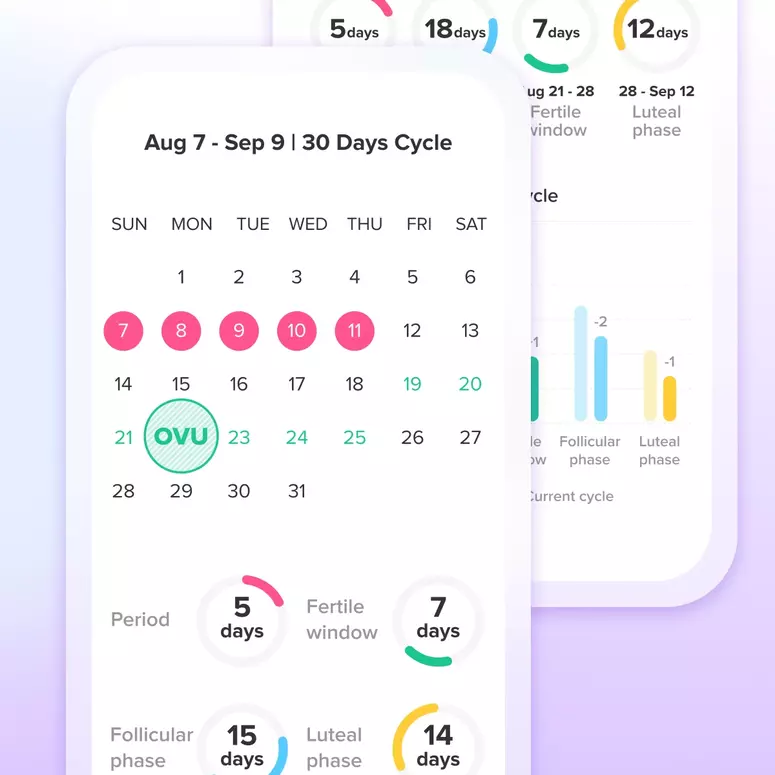
Let's Glow!
Achieve your health goals from period to parenting.