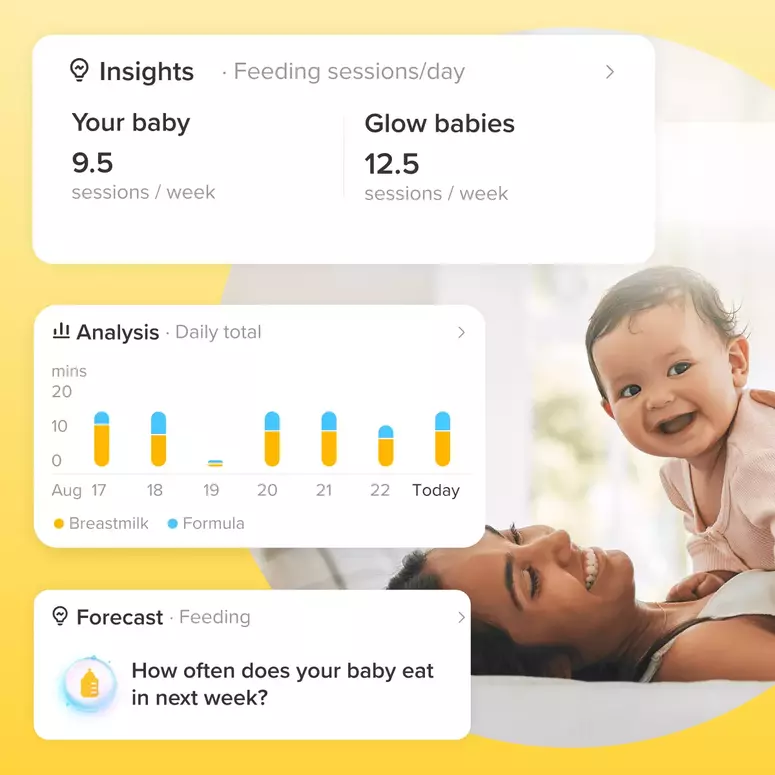
Understanding the chart
How do you read this chart? What does it mean? Can someone help me understand it please? 
Add Comment
Let's Glow!
Achieve your health goals from period to parenting.