Shop
Glow Premium
CuboAI
Oura Ring
Owlet
Tempdrop
Apps
Glow
Glow Nurture
Glow Baby
Eve by Glow
Guides
Reproductive Health
Reproductive Health
Health and wellness
Getting pregnant
Difficulty Getting Pregnant
Fertility Products
Pregnancy Health
Pregnancy
Staying Healthy
Giving Birth
Pregnancy Products
Postpartum Health
Baby’s Growth and Development
Baby’s First Year
Baby’s Health
Parenting
Postpartum Health
Baby Products
Community
General Women’s Health
A supportive and informative space dedicated to discussing and exploring a wide array of topics related to women’s health.
Reproductive Health
Topics encompassing menstrual health, fertility, contraception, pregnancy, and more.
Work-Life Harmony
A broad spectrum of topics, including nutrition, beauty, wellness routines, work and lifestyle.
Get Glow Premium
Home
/
Community
/
BBT Help & Chart Analysis
Can y’all help me interpret this chart?
Can y’all help me interpret this chart?
Comment
You
Add Comment
I don’t know how to read this chart help me out!!!
Previous
Did I ovulate?? Mild lean pcos
Next
Let's Glow!
Achieve your health goals from period to parenting.
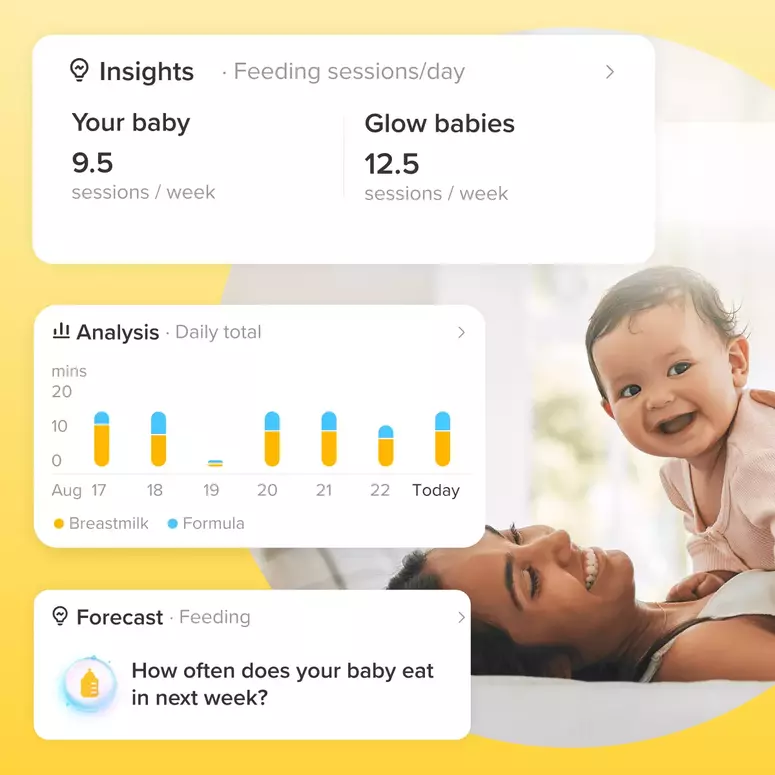
The Top Baby Tracker App: Embrace New Beginnings with Tender Care
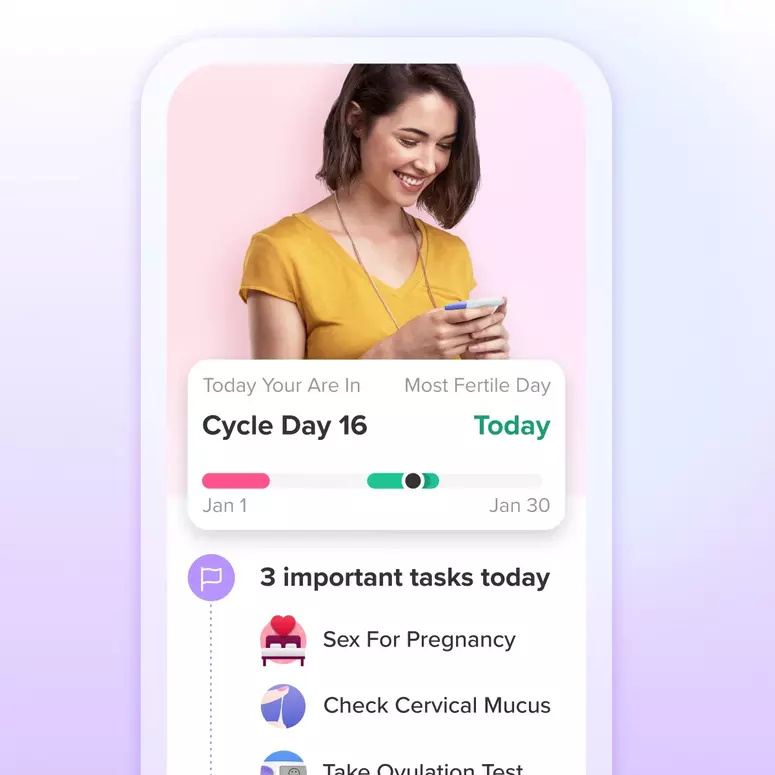
The Top Fertility Tracker App: Your Path to Achieving Pregnancy
The Top Pregnancy App: Nurturing Your Journey to Motherhood
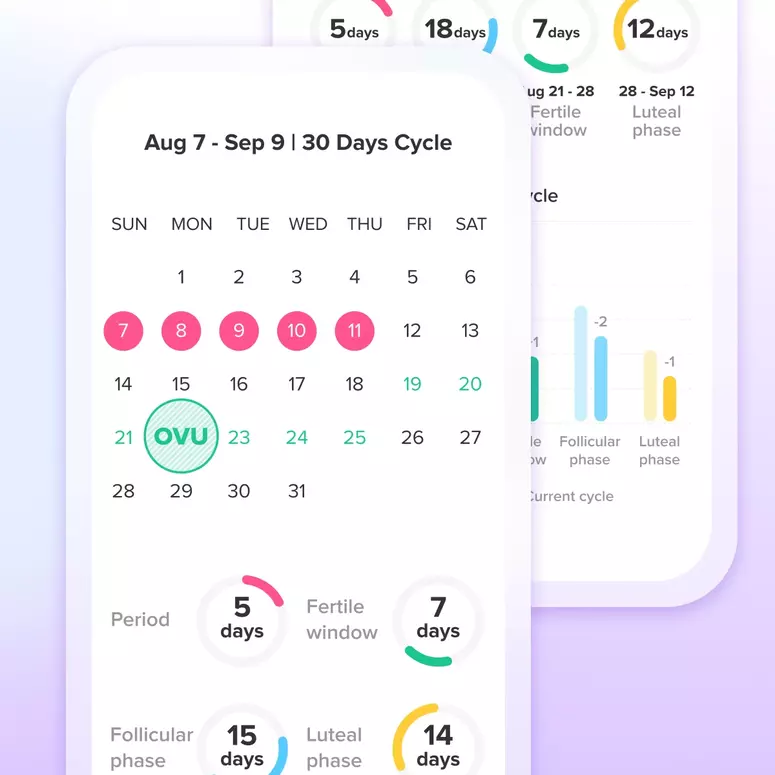
The Top Period Tracker for Empowering Your Menstrual Health Journey