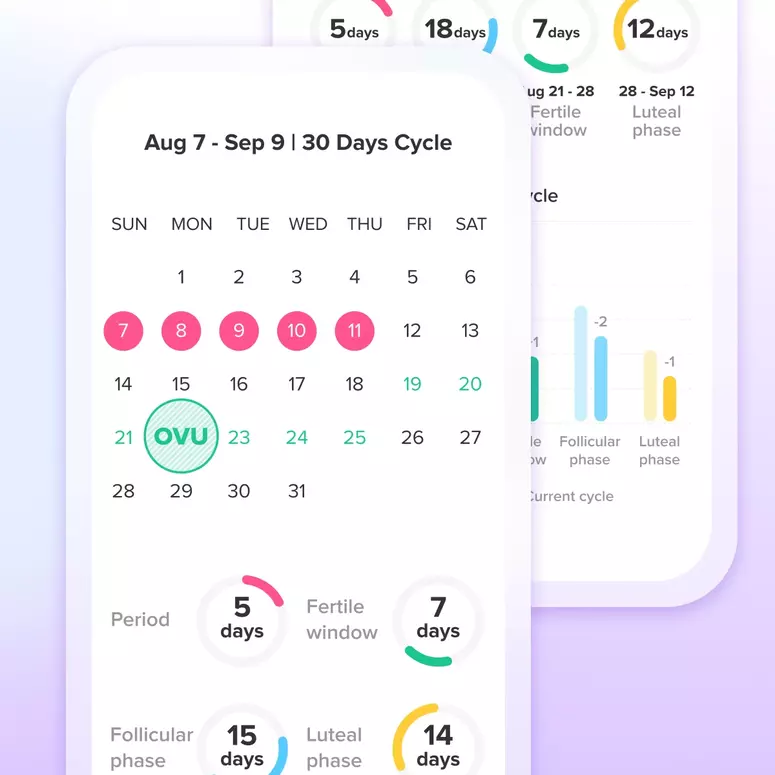
​​​​​​​​​​​​​​​​​​​​​​​​​​​​​​​​​​​​​​​​​​​​​​​​​​​​​​​​​​​​​​​​​​​​​​​​​​​​​​​​​​​​​​​​​​​​​​​​​​​​​​​​​​​​​​​​​​​​​​​​​​​​​​​​​​​​​​​​​​​​​​​​​​​​​​​​​​​​​​​​​​​​​​​​​​​​​​​​​​​​​​​​​​So im new to charting. Can someone explain the chart to me

Re

Rebecca
43 views • 0 upvotes • 1 comment

COMMENT (1)

Kr

Posted at
Hello!! You have an easy to read chart. You appear to have ovulated on cycle day 16. When you have a sharp dip in your temperature it usually indicates that ovulation is about to occur within 12-48hrs. Ovulation is shown by a sharp/ sometimes gradual rise in your remaining temperatures for the month, until your temps drop again, to show your impending period. Remember that the more information you enter, the better and easier it is to interpret your chart. Best of luck!!!