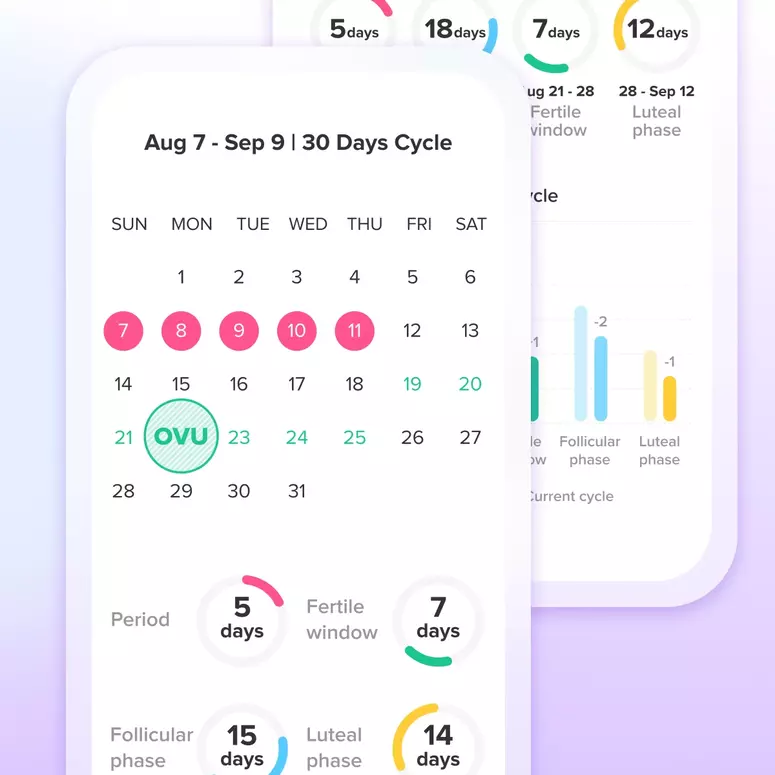
Understanding bbt chart
Can anyone help me decipher my chart? To my understanding I see the peak after I ovulated and then the spike down, then it went up after that and has been up. What does the rise mean after ovulation? Or is that just normal?

Add Comment

Let's Glow!
Achieve your health goals from period to parenting.