BBT Chart Help!
This is my first month charting my bbt. This is what I have so far. Does it look right? How long does your temperature stay up after ovulating? I can't seem to get the whole chart in one picture, but before ovulating my bbt was between 97.4 - 97.7...never higher than that until after ovulation. Any input is appreciated, as I've never done this before. Thanks!! 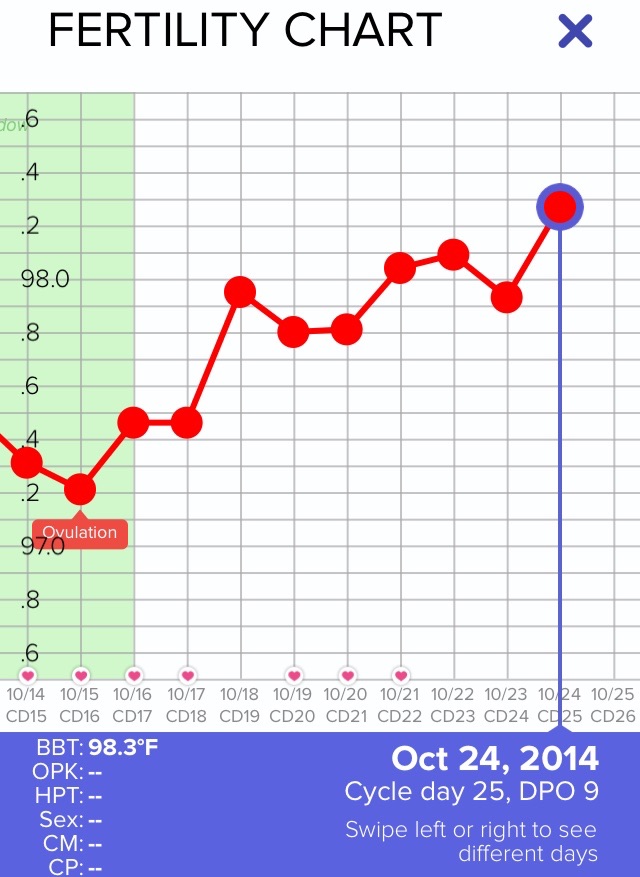
Add Comment
Let’s Glow
Glow is here for you on your path to pregnancy
Glow helps you navigate your fertility journey with smart tools, personalized insights, and guidance from medical experts who understand what matters most.
25+ million
Users
4.8 stars
200k+ app ratings
20+
Medical advisors